Digital Production Services Homepage Brown University Library Homepage Brown University Homepage

c u r i o

Imaging rare, unusual, and intriguing objects at the Brown University Library

Visualizing Temperance

March 8, 2013 by | Comments Off on Visualizing Temperance

quote from M.D.

Ideally, data visualization techniques can facilitate discovery of trends within data sets, exposing previously unnoticed interconnections among and between data points, or otherwise confirm or dispute assumptions, which in turn can fuel further inquiry. But data visualization techniques, in the broadest sense, are also used for more message-driven or even outright propagandistic purposes. In many cases, the two modes of analysis — open-ended inquiry, on the one hand, and message-driven campaigns, on the other — quickly become intertwined in practice.

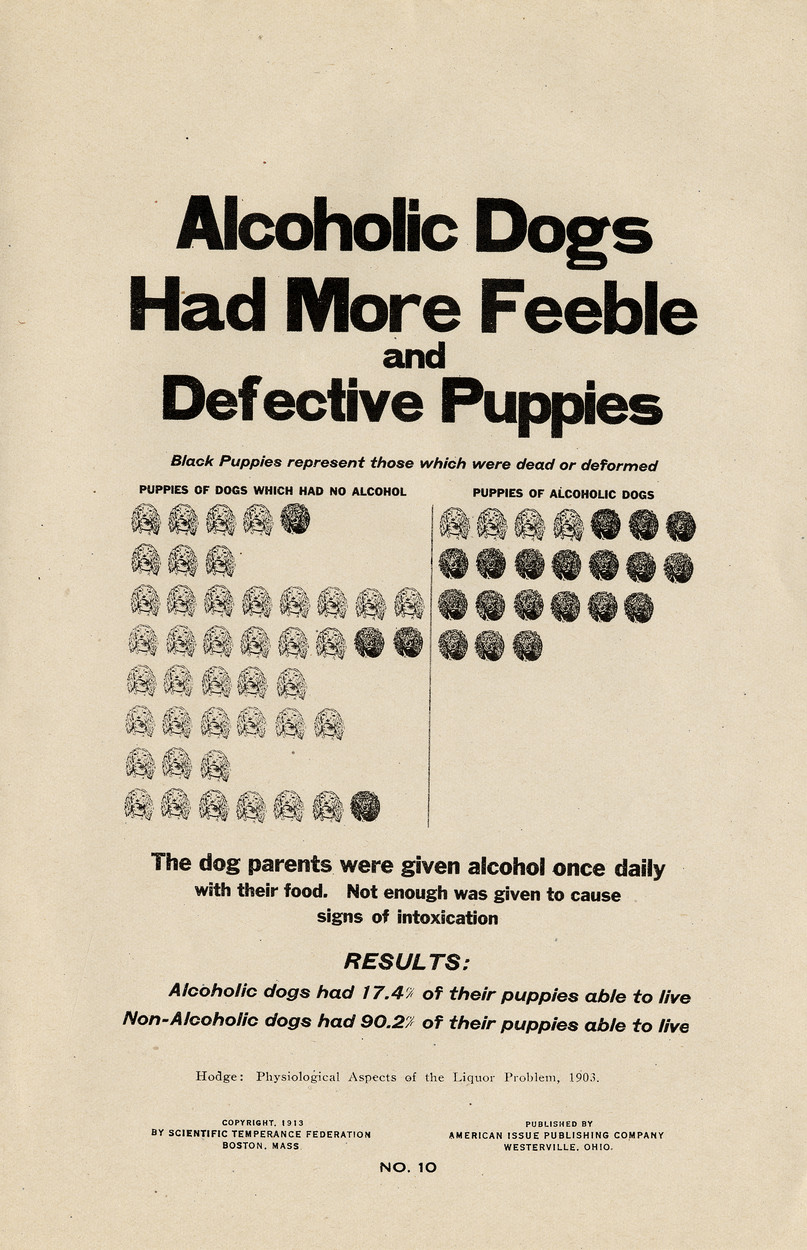
Below are some examples from the library’s “Alcohol, Temperance, and Prohibition” digital collection (a subset of the Chester H. Kirk Collection on Alcoholism and Alcoholics Anonymous). As noted in the digital collection’s accompanying online essay by Leah Rae Berk, the graphs, while visually convincing, are usually designed to suit exaggerated or predetermined causal claims, or else present only fragmented analyses, to stress the (no doubt oftentimes significant) influence of alcohol, above all else:

…A number of Temperance and Prohibition Era posters, like a number of the religious pamphlets, used a logos format to make a pathos appeal. These posters contained graphs and statistical information, presenting moral claims as factual information, such as “Alcoholism and Degeneracy,” “Intemperance as a Cause of Poverty Greatly Reduced Since Prohibition” and “Drink, A Great Cause of Immorality.” The poster “Drink, A Great Cause of Immorality” showed the results of a study of 865 Immoral Inebriate Women, claiming that 40% of their immorality was due solely to drink, including as evidence a statement by a medical expert: “There is no apparent reason why any of the persons…should have become immoral but for preceding alcoholism.” “Intemperance as a Cause of Poverty Greatly Reduced Since Prohibition” presented a graph that tracked the drop in poverty as a result of increased temperance, therefore conflating intemperance and immoral behavior with greater social ills like poverty….

"Drink Impaired Scholarship"

“Drink Impaired Scholarship”

Coffee Pots and Clipping Paths

October 25, 2012 by | Comments Off on Coffee Pots and Clipping Paths

In addition to photographing Special Collections materials for ongoing digital projects, or for patron requests for publication, Digital Production Services also digitizes items to be featured in library-produced promotional publications. In 2008, a coffee pot once owned by “Dr. Bob” (Rober Holbrook Smith), a founder of Alcoholics Anonymous, was taken off the shelf and set against a simple white background to be photographed.

The photograph itself is a straightforward shot — at the time, captured using the John Hay Library’s Nikon Digital SLR camera. However, to remove the background for a publication layout, “clipping paths” were created in Adobe Photoshop. Clipping paths are a useful way to mask-out the background within a scene — in other words, clipping paths can be used to visually define the edge of an irregularly-shaped object which does not conform to a standard rectangle-based crop.


Above, L–R: detail of coffee pot digital image; detail of image with background removed via pixel-based selection; detail of image showing vector-based clipping path overlaying pixel grid; clipping-path-masked image as placed in final layout.

There are pixel-based methods of creating masks in Photoshop, although clipping paths offer a unique solution, storing resolution-independent Bézier-curved (vector-based) edges alongside the pixel-based image grid, particularly useful for layered layout designs. Curves used for clipping paths are the same vector-based curves now becoming more widely supported by web browsers, as part of the Scalable Vector Graphics (SVG) specification and HTML5’s <canvas> tag scripting. (For an example of resolution-independent, vector-based curves implemented solely via web-based technologies, see this proof-of-concept site by a Google employee.)