
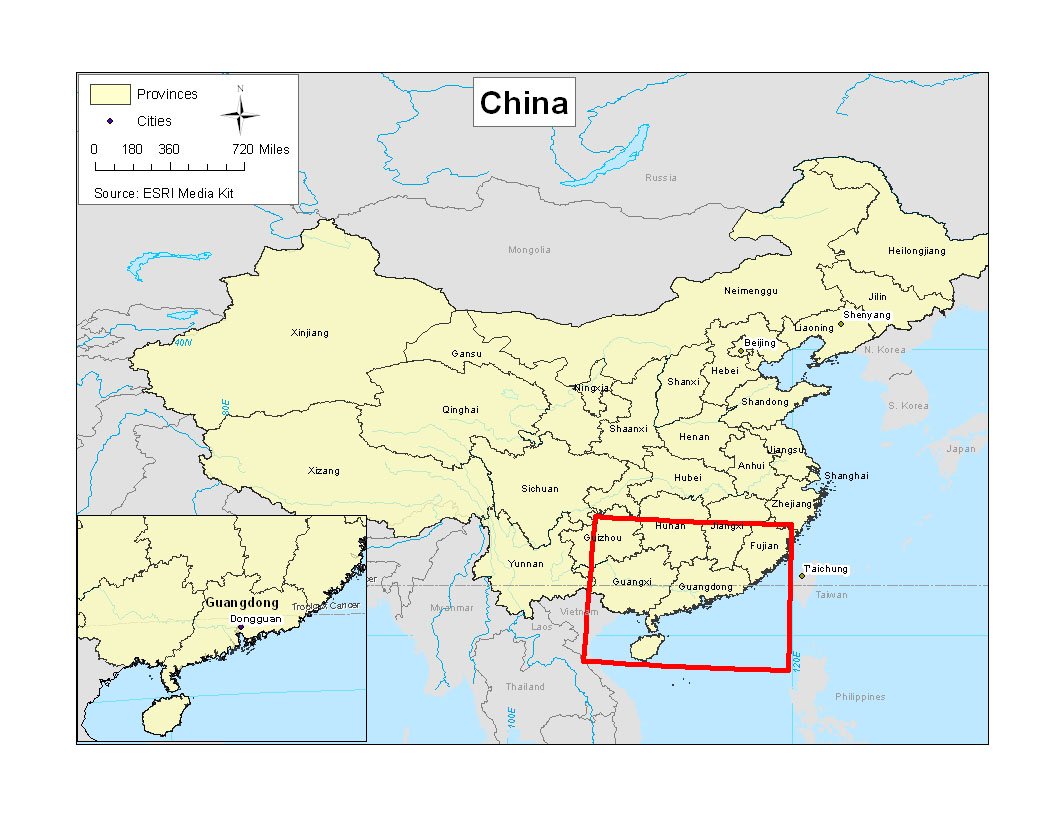
Map of China
How did Stieve conduct his research on China?
Demographic data was obtained from Chinese census data and boundaries from ESRI data, both available at the Library. All layers were imported into ArcMap and demographic data was joined to boundary files. Locations of the places mentioned in the story were plotted using their coordinates.
For more information regarding Stieve's research methodology, review the Library Resource Guide for Spatial Data and GIS and the Library FAQs.
Population Location and Migration
Agricultural Census Data
This map shows the population density of those working in the agricultural industry

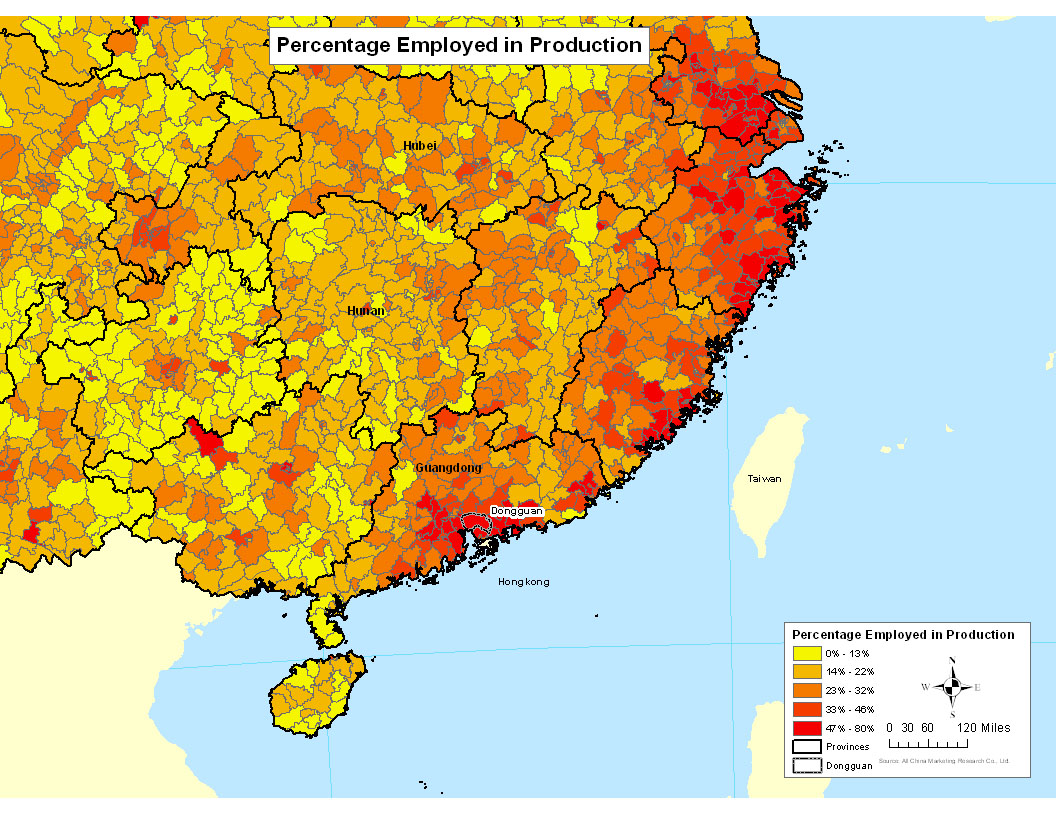
Production Industry Census Data
Here is the population dispersment of those working in the production industry
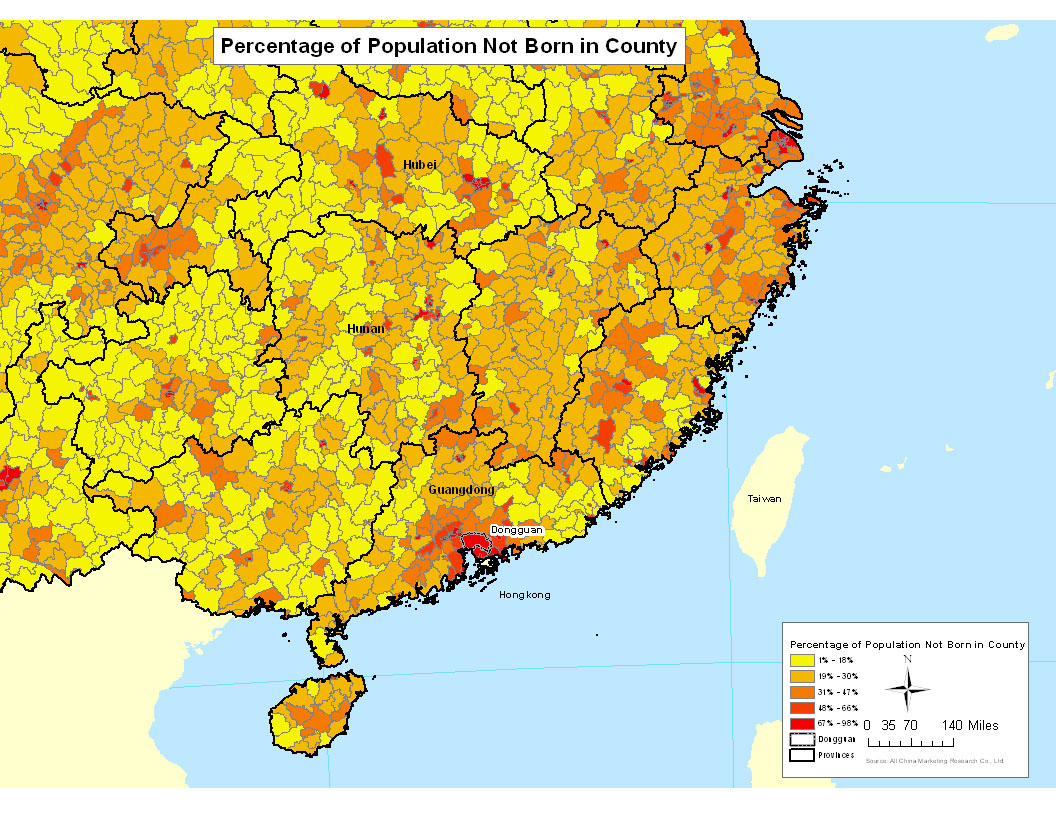
Nativity
This map shows the percentage of the population not born to the district they are living in. This indicates the population of migrant workers in any given area
This is an interactive map that chronicles the major locations in Factory Girls.
- Yellow markers indicate areas that are pertinent to the Zhang family.
- Blue indicates LuQingmin.
- Green indicates WuChunming.
- Red locations are those that two or more individuals are tied to.
View Factory Girls in a larger map